Reflections on a prioritization framework for detection engineering effort
You can skip to this part to go to the real stuff.
I. Context
I recently moved from a platform security role to a detection engineering one. I now spend most of my days at $COMPANY automating the aggregation and analysis of threat intelligence to spot emerging threats and prioritize our detection efforts. Like every company our size, we have a lot of assets and limited resources (financial and human) to protect them.
When you look at how security teams traditionally operate1, a pattern emerges:
- A security baseline2 is defined and applied to (most) assets.
- As new assets get deployed (a new K8s cluster, a new shiny SaaS app, whatever), they usually get onboarded onto that baseline.
These tasks can get really complex. Depending on technical debt, company size, tech strategy, and so on, designing and implementing them can take days, weeks, sometimes months. But they are essentially one-shot: once live, they require little-to-no upkeep. Big build phase, small run phase.
Detection engineering, along blue team operations, handles what’s remaining: you’ve spent $n$ {hours, days, months} hardening your workloads, and now you have to keep them safe for $n$ years. Patching, upgrading, reverting, plenty of fun awaits the fool who thought the road ended when kubectl apply returned 0. And unlike a baseline, detection has no finish line: knowing when your assets are being compromised is a job that is never “done”. Small build phase, infinite run phase.
Detect behaviors, not tools
Something blue teams often overlook is that threat actors operate like organisations. The malware they ship is often the most discussed topic in threat reports and blog posts, but it’s only a tool supporting bigger operations and campaigns. And just like in any company, changing the processes behind those operations (the modus operandi) is slow and painful. CTI analysts capture this with the well-known “Pyramid of Pain”:
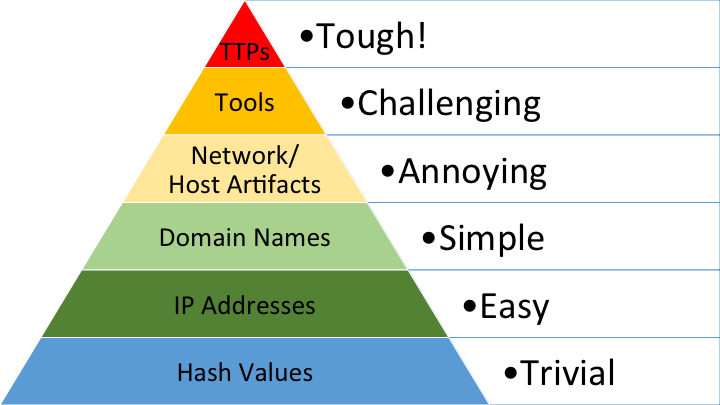
The pyramid ranks indicators by how much pain it costs the adversary to change them. Hash values are trivial to swap; tactics, techniques and procedures (TTPs) are the hardest. Rewriting malware in a new language (or just tweaking artefacts) is cheap and instantly burns every previously known IOC. But changing the way the campaign fundamentally behaves is expensive. That’s why focusing on behaviors instead of tools is the key to proper detection.
Proper priorization is hard
Most detection prioritization runs on gut feeling: “I think this webserver might get targeted”, or “I read on Hacker News that APT28 is dropping 0-days through Excalidraw”. Plenty of organizations rely on CVSS and engineers’ experience to estimate the severity and likelihood of a risk or a vulnerability. These are reasonable starting points, but they don’t scale at the pace adversarial operations evolve.
Inherently, behaviors are the right thing to track, but there is a huge number of them: the reference in the field, the MITRE ATT&CK v19 Enterprise matrix lists 15 tactics, 222 techniques, and 475 sub-techniques. You can’t cover all of that by gut feeling, and you certainly can’t cover all of it at once.
So, what do we do?
II. The framework
We do have a lot of information about past and ongoing cyberattacks. You can pay a vendor to provide the intel to you, or if you have the time/money/expertise you can deploy your own threat intelligence platform (TIP). But again, accumulating data for the sake of it is kinda useless.
I was thinking about how we could leverage all this intel to try to know which TTP is more likely to be used against $COMPANY, and ended up on some unexpected things.
Bayes’ Theorem
Bayes’ Theorem is, according to Wikipedia3:
a mathematical rule for inverting conditional probabilities, allowing the probability of a cause to be found given its effect. For example, with Bayes’ theorem, the probability that a patient has a disease given that they tested positive for that disease can be found using the probability that the test yields a positive result when the disease is present.
This very cool Veritasium YouTube video explains it nicely.
The Bayes’s Theorem can be mathematically expressed as:
$$ P(A\vert B)={\frac {P(B\vert A)P(A)}{P(B)}} $$
where:
- $A$ and $B$ are events;
- $P(A\vert B)$ is the posterior: the probability of event $A$ occurring given that $B$ is true;
- $P(B\vert A)$ is the likelihood: the probability of event $B$ occurring given that $A$ is true;
- $P(A)$ and $P(B)$ are the probabilities of observing $A$ and $B$ without any given conditions.
Can we use this formula to get the probability of being targeted by a specific technique $T$ given our organisational profile $O$ and all the evidence $E$ (the intelligence reports from our TIP) we have?
Detection-specific Bayesian inference
First of all, we must calculate the prior, which is the historical baseline risk of a TTP targeting a given organisational profile. To avoid the “zero-frequency problem” with TTPs being new or not yet seen, we’ll use Laplace smoothing ($\alpha = 1$). Here’s our prior formula:
$$ P(T \mid O) = \frac{N(T, O) + 1}{\sum (N(T_i, O) + 1)} $$
where:
- $N(T, O)$ is the total historical count of this TTP targeting the profile;
- $\sum N(T_i, O)$ is the total count of all TTPs targeting this profile.
Then, we will build an Evidence Score $S_E$ that will evaluate STIX reports from the last 90 days. Each report $i$ is assigned a specific weight based on three factors:
- Confidence Score ($C_i$), which is the STIX confidence level of the source, normalized between $0$ and $1$;
- Match Multiplier ($W_i$):
- $1.0$ if the report matches the mandatory Sector and Geography;
- $1.5$ if it also matches an optional Technology defined in the profile.
- Delayed Decay ($D(t_i)$) based on the created date ($t_i$ in days old), with a 14-day plateau where the threat remains at maximum relevance before exponentially decaying to avoid under-estimating very good reports that took some time to be published (decay rate $\gamma \approx 0.05$):
- If $t_i \le 14$: $D(t_i) = 1$;
- If $t_i > 14$: $D(t_i) = e^{- \gamma \cdot (t_i - 14)}$.
The final weight for a single report is: $$ Weight_i = C_i \cdot W_i \cdot D(t_i) $$
The total Evidence Score is the sum of all report weights:
$$ S_E = \sum_{i=1}^{N} Weight_i $$
We can now translate the raw Evidence Score into a Likelihood probability using a sigmoid function to “squash” $S_E$ between 0 and 1:
$$ P(E \mid T, O) = \frac{1}{1 + e^{-k(S_E - x_0)}} $$
where:
- $k$ is the growth rate parameter;
- $x_0$ is the threshold parameter.
A constant background noise probability $P(E \mid \neg T, O)$ (e.g., $0.05$) is defined to represent false positives, its current value being kinda random.
And finally, we can compute the Posterior, the final updated risk percentage using Bayes’ theorem:
$$ P(T \mid E, O) = \frac{P(E \mid T, O) \cdot P(T \mid O)}{P(E \mid T, O) \cdot P(T \mid O) + P(E \mid \neg T, O) \cdot P(\neg T \mid O)} $$
By repeating this formula on every TTP, we should be able to dynamically know, based on past and new intelligence being ingested, which TTP is more likely to impact us in the future!
III. Next steps
I’ve been thinking about it for a few weeks now4, but still, I didn’t write a single line of code. Putting everything together into working software isn’t easy: we must talk to a TIP (OpenCTI offers a GraphQL API, which I’ve never played with), find a good representation of an organisational profile, store probabilities in a datastore (SQL? TSDB?), expose an API or a webapp to render the probabilities…
I could throw this blog post into an LLM and ask it to assemble the project, but I wouldn’t feel satisfied. I spent too much time thinking about this to end up just delegating the work to something or someone else. Maybe I’ll take the time to build something?
Anyways, congrats if you made it all the way down here. I’m not a mathematician whatsoever, so if I got something wrong or you have feedback, please reach out!
Take care
H
-
YMMV ↩︎
-
Examples of such checks are enforcing the Docker base image in the CI jobs, making sure that all versions are pinned with a checksum, deploying CEL policies to block dangerous configurations from reaching your K8s cluster, … ↩︎
-
I started drafting this article on June 9th, and my first notes about this idea go back to mid-May. ↩︎