The painful journey into finding who attempted a TCP connection
Recently at work, we had to investigate a strange case where TCP requests from an unknown process spawned and got blocked. We had the host and the port the process tried to reach in the logs, the environment, and… that’s all. The process was trying to reach the loopback address on the node it were running, on port 8200. The modern tech conoisseurs will surely notice that port 8200 is the default Hashicorp Vault port, which was running on this node. That was enough for us to dedicate a few hours into the investigation.
netstat, strace, tcpdump & co.
Our first attemps were directed toward the typical tooling you’ll use in a GNU/Linux environment to monitor opened connections. However, and that was our main struggle, once the process was spawned, it tried once to open a conection to localhost:8200 and then stopped. The whole process was taking less than a millisecond, which made it almost impossible for those tools to:
- detect a new process trying to open a TCP connection;
- get the PID;
- go read in
/proc/${PID}/cmdline.
When arriving at the step 3), the /proc/${PID} directory was already long gone, making the process name retrieval impossible.
First attempt at eBPF
After spending some time on trying to solve this issue with conventional tooling, we finally leaned toward creating a custom tool using eBPF. Here’s what I got:
tracepoint:syscalls:sys_enter_connect {
  $sa = (struct sockaddr*)args->uservaddr;
  if ($sa->sa_family == 2) {
    $in = (struct sockaddr_in*)$sa;
    $port = ($in->sin_port >> 8) | (($in->sin_port << 8) & 0xff00);
    if ($port == 8200 && $in->sin_addr.s_addr == 0x0100007f) {
      printf("%s - %s (PID %d) -> localhost:8200\n",
             strftime("%H:%M:%S", nsecs),
             comm, pid);
    }
  }
}
This program attaches to the sys_enter_connect tracepoint which is called with each connect(2). It then grabs the first argument, uservaddr, which is a user‐pointer to a struct sockaddr. It checks that we’re dealing with IPv4 ($sa->sa_family == 2), checks that the address and the port are both 127.0.0.1 and 8200, and finally outputs the timestamp, the process name and the PID.
We can either run this program as an argument to bpftrace (using -e), or as a file:

However, for reasons still unknown to this day, we never succeeded to make it work on the concerned node, even if the architecture was seemingly the same as my local machine. We decided to not spend too much time debugging, and moved forward.
egress-auditor
In parallel to our forensics effort, I was chatting with a former colleague I worked with a few years ago. He told me that he recently had a quite similar issue, and created egress-auditor in an attempt to solve it.
What egress-auditor does is watching new egress connection created, and then propose Iptables rules to allow them or not. It relies on NFLOG to store the data, which is quite smart. In our case, we do not really care about the proposed Iptables rules, but we want the logs displayed like this:
new TCP connection 192.168.1.229:60166 -> 146.148.13.123:443(https) by curl
egress-auditor have the issues as the other tools mentionned in the first part. But as it does the process name checks automatically instead of just displaying the PID, we thought that we just could let it run in the background and eventually timings would match.
But we encoutered a few issues, especially when working with loopback addresses (it has since been fixed in 1d3e067), so we did not keep working on this for too long and moved on.
Second attempt at eBPF
So here we go again with eBPF! But this time using an already-existing tool shared by the eBPF GOAT Brendan Gregg: tcpconnect. It can be installed using the bpfcc-tools package, and is literally plug n’ play:
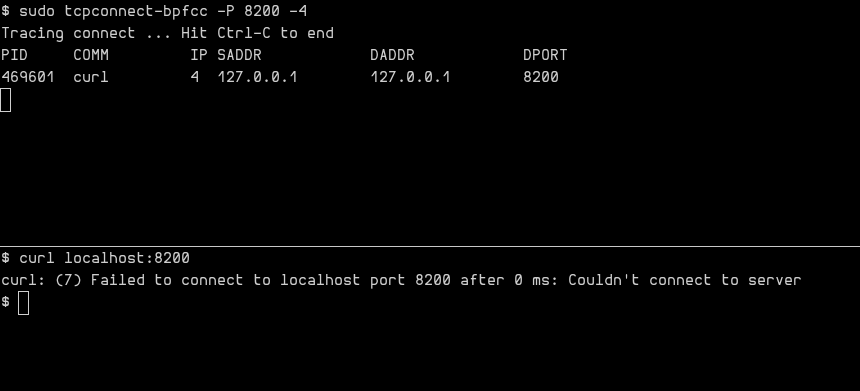
By setting up the required packages properly and running the tool, we finally managed to identify culprit process, and fix the issue! This should probably have been our first attempt at eBPF, but the temptation to build something ourselves was too big I guess.
Lessons learned
In the end, it took us almost a full day to find and fix the issue. It’s quite long, yeah. Especially for something that ended up not being important (hopefully!). So lessons learned:
- know your tools and have clear forensics processes: it can literally save you hours.
- localhost may or may not be resolved (aka RTFM instead of thinking you found a bug in cURL):
Application software MAY recognize localhost names as special, or MAY pass them to name resolution APIs as they would for other domain names.