Bootstraping a PoC for my detection engineering prioritization framework
If you haven’t read it yet, you can go my article, Reflections on a prioritization framework for detection engineering effort , that explains all the base concepts.
I. PoC || GTFO
At the end of my last post about building a new prioritization framework from the ground-up, I said that I was too lazy to jump into the implementation of my idea. However, putting everything into an article greatly motivated me to do the extra-miles required to put in place a minimal viable proof-of-concept and see if it works in the real world.
This post will explain shortly which tech stack I chosed, how I implemented the math and how I integrated it to our alerting system so the computations can be leveraged.
II. Predikat
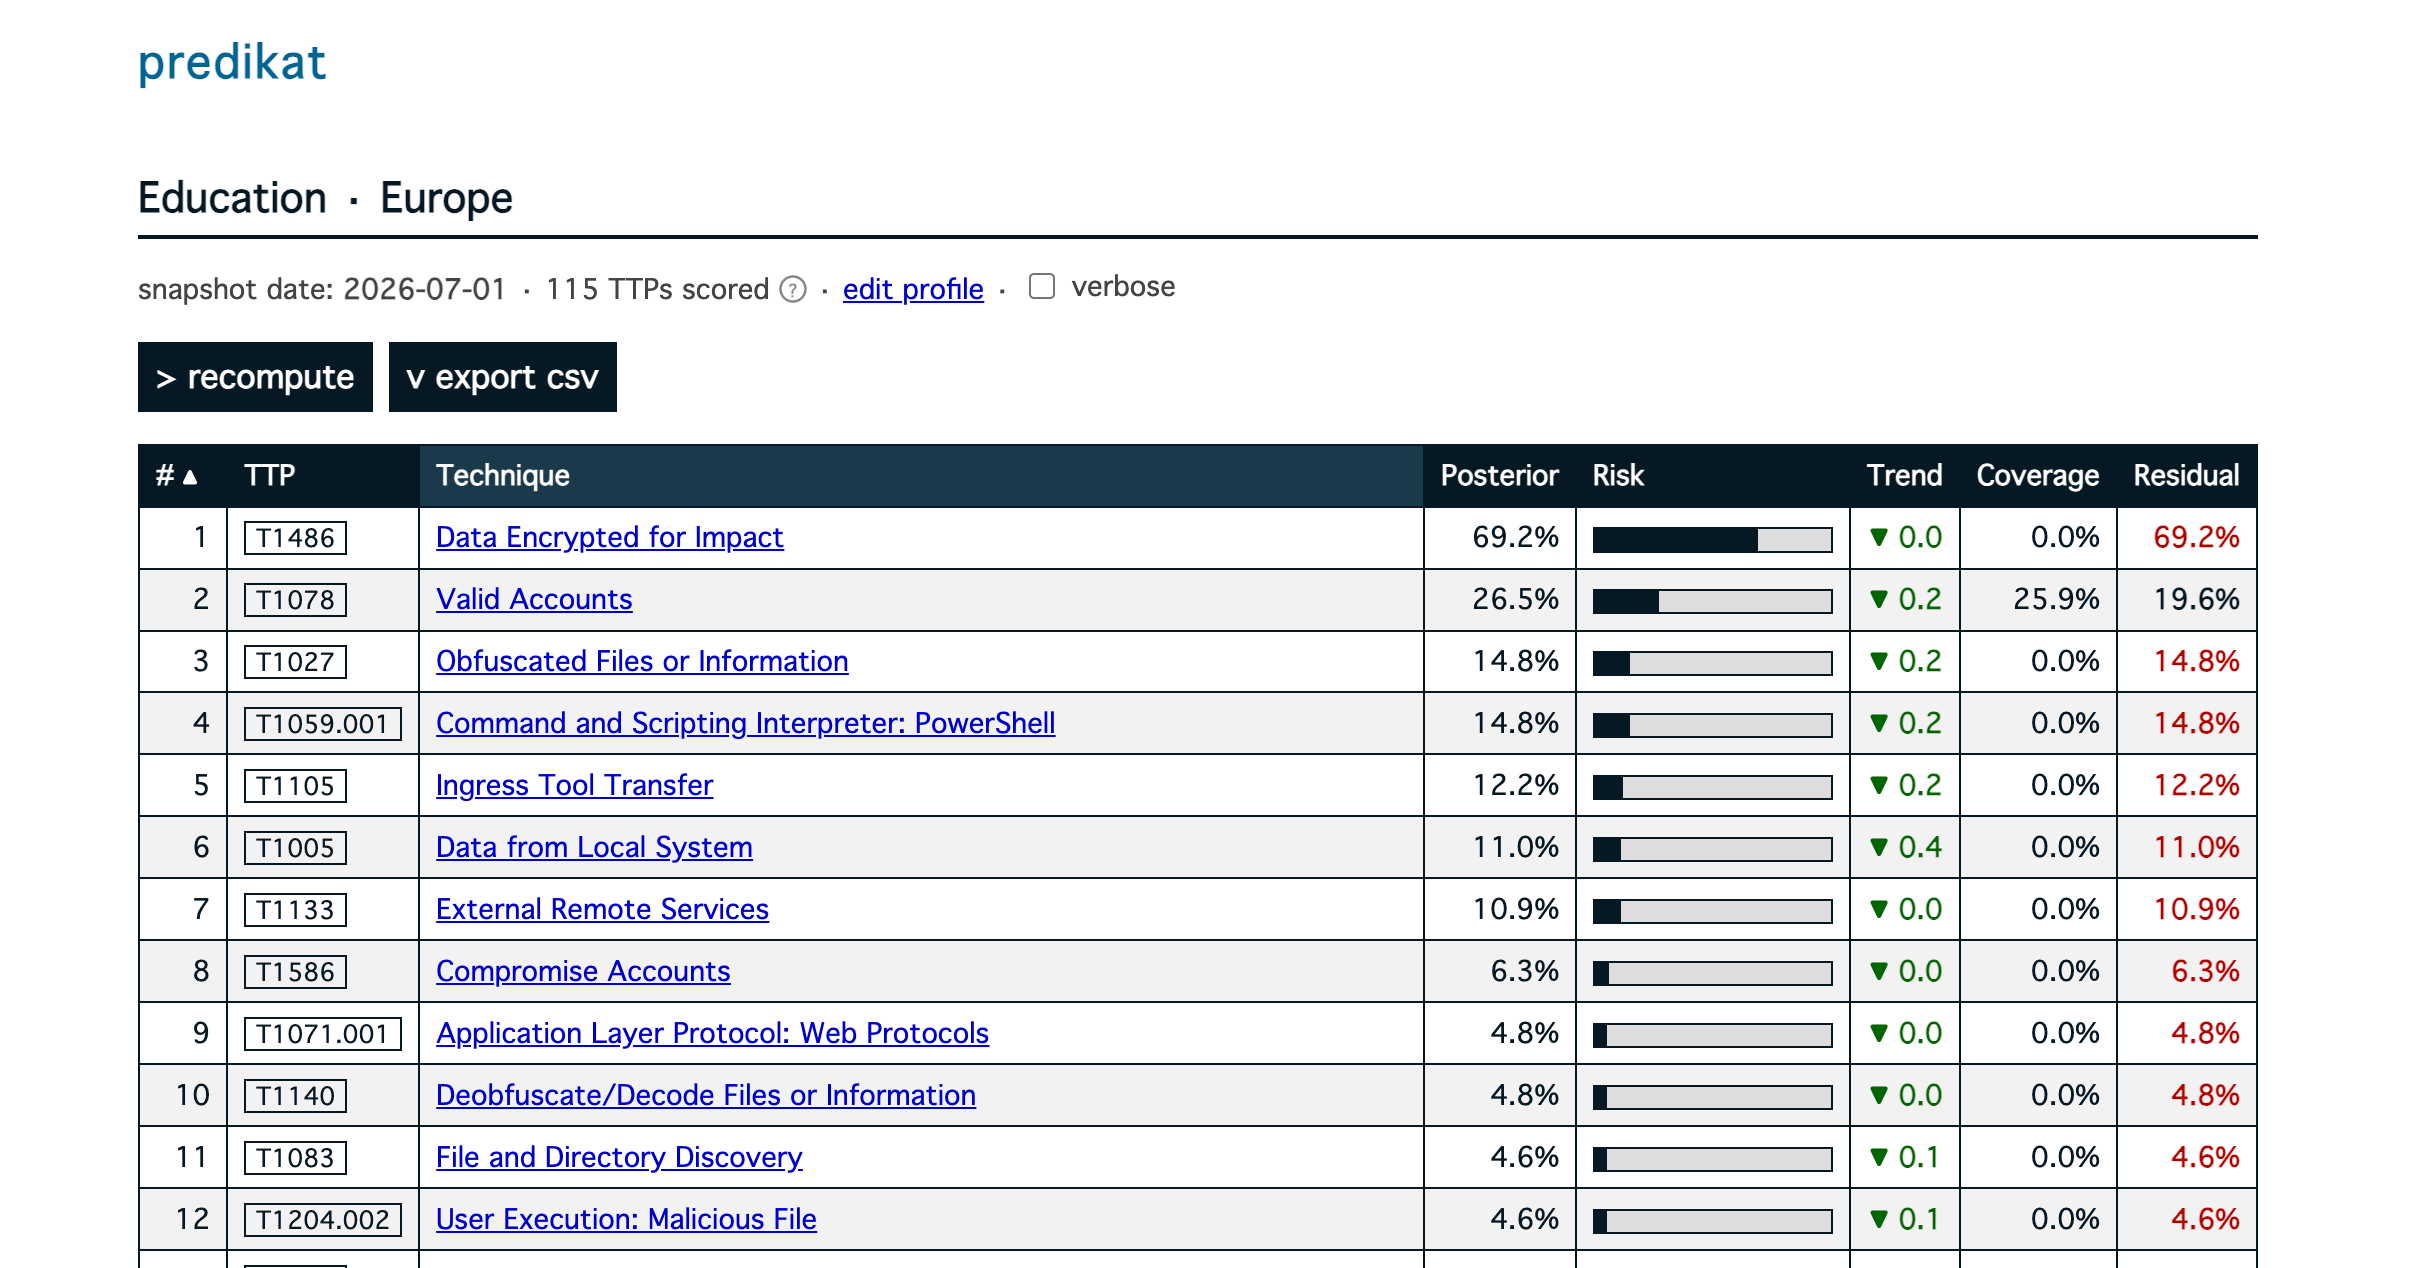
predikat is a single binary application, using a very boring but easy-to-work-on stack: Go’s net/http package for the web interface with Go templates for rendering, Sqlite for data storage, vanilla JS and CSS to keep things as simple as possible. It talks with $COMPANY Threat Intelligence Platform to get the intel details, and save the computation results to a local Sqlite database.
Making the tool useful
Having a compute engine is cool and all, but if the results can’t be leveraged to improve detection capabilities, then it is kinda useless.
I added a connector to our alert management system, and luckily we already did the work to map every alert to the relevant ATT&CK techniques ID, so linking it all together to compute coverage and risk was easy.
Coverage
The standard mathematical approach for this in reliability engineering seems to be using an asymptotic exponential decay function1. It starts fast and slowly flattens out, approaching but never actually touching 100%. Let $N$ be the number of active detection rules covering a specific TTP for a given asset, we can compute the Coverage using the following formula:
$$ Coverage(N) = 1 - e^{-\mu \cdot N} $$
where:
- $e$ is Euler’s number (standard math constant);
- $\mu$ (mu) is the “efficiency” weight of a single rule.
For example, with $\mu = 0.3$, no rules leads to 0% coverage, 3 rules = 59% coverage and 10 rules is 95% coverage.
Residual risk
Once you have we have our (defense) Coverage and our Posterior, calculating the real exposure is simple multiplication. If the Bayesian engine says the Posterior risk of T1566 (Phishing) is 80%, and we have 3 detection rules that give us a 60% coverage:
$$ Residual Risk = Posterior \times (1 - Coverage) $$
$$ Residual Risk = 0.80 \times (1 - 0.60) = 0.32 $$
So if a TTP has a 90% Posterior but we have 10 rules for it, then the Residual Risk drops to 4.5%, increasing our confidence in our ability to detect this threat. However, if a TTP has a 60% Posterior but 0 detection rules, the Residual Risk remains at 60%, making the threat likely to be both exploited and undetected.
We can also check the trend of a specific technique within an Organisational Profile:
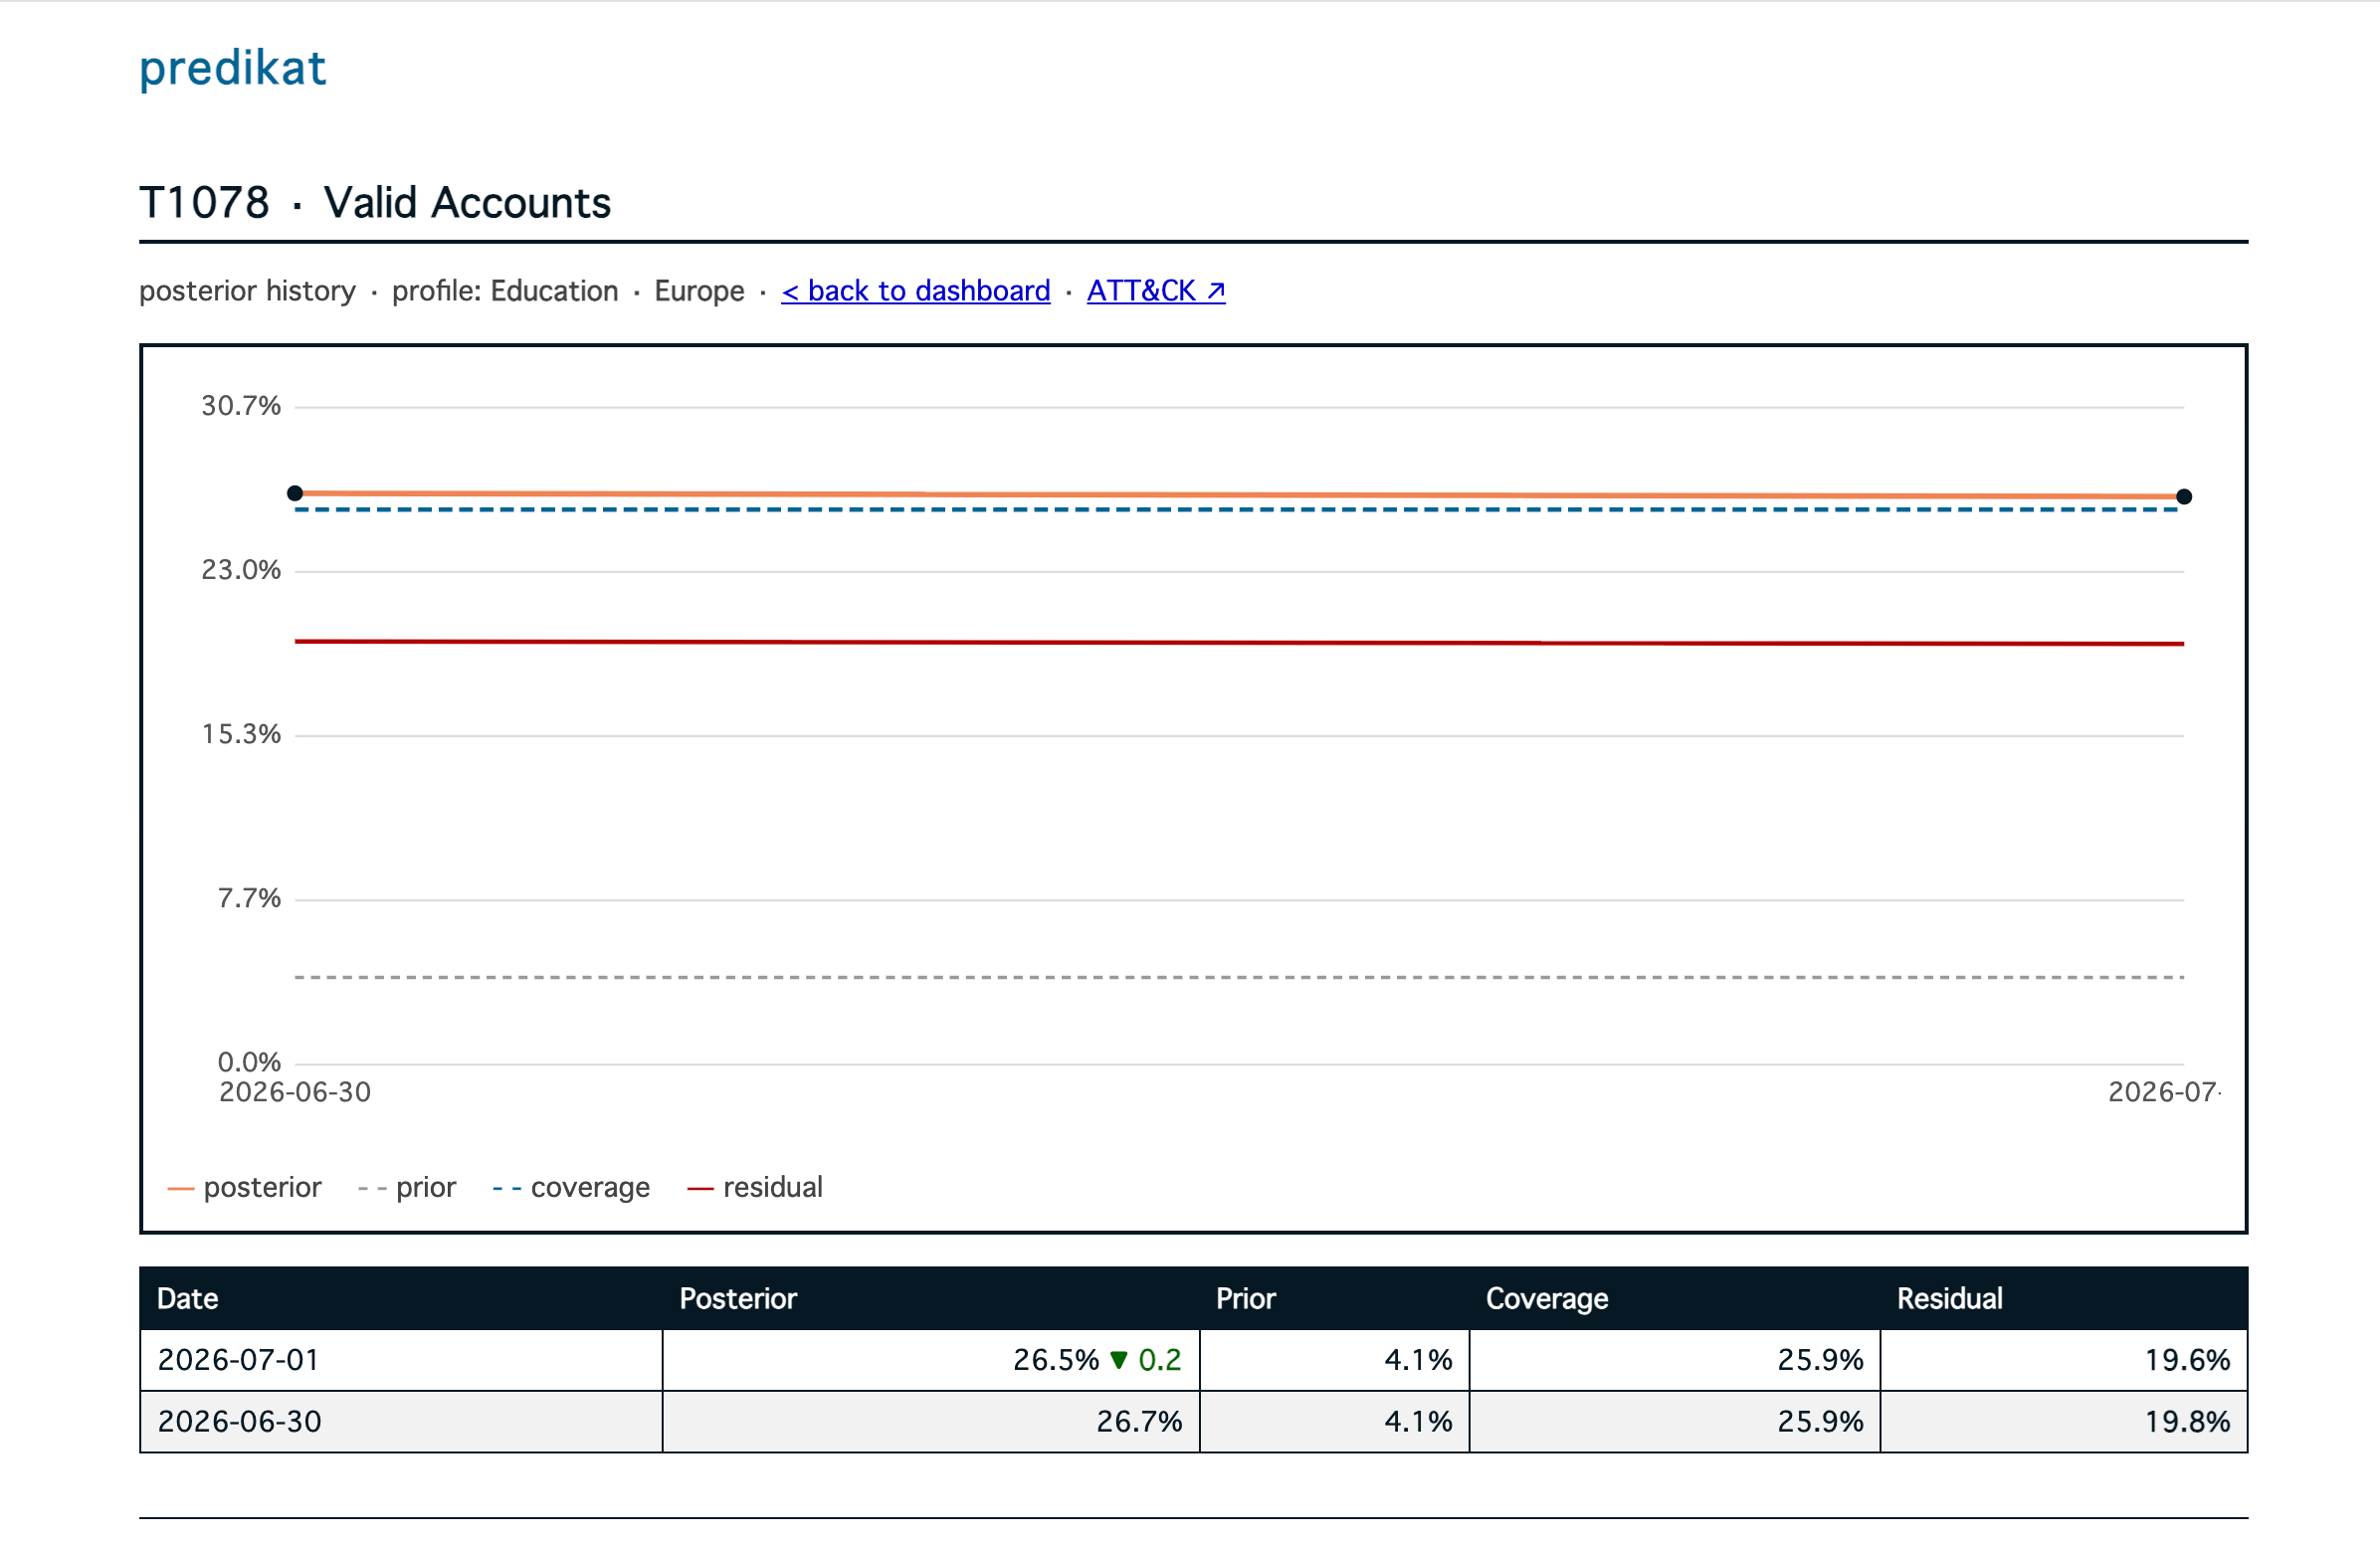
T1078 in the Education in Europe OP. 2 days of data isn’t a lot, but you get the idea!
III. The future
The tool is currently very early into its development, and a few features are missing:
- add assets to the Organisational Profile, so selected reports are more relevant (we could add a bigger weight to reports mentionning both the region and the technology);
- add a per-asset coverage and residual risk compute;
- add more connectors to other platforms providing alerts;
- maybe open-sourcing the tool?